


Discover the power of our Exploratory Data Analysis Tool Online, designed to simplify the data analysis process for users of all skill levels. This intuitive platform allows you to effortlessly import, clean, and visualize your data, enabling you to uncover meaningful insights quickly.
With a user-friendly interface, you can engage in interactive data exploration, generate comprehensive reports, and collaborate with team members seamlessly. Whether you’re a seasoned data scientist or just starting out, our tool empowers you to make informed decisions and drive impactful outcomes with your data. Join us today and transform the way you analyze and interpret your data!
Best Exploratory Data Analysis Tool Online
Exploratory Data Analysis (EDA) Tool
Also See: SandDance Data Tool Online, Query Csv With Sql Online
Information about the Tool: “Exploratory Data Analysis (EDA) Tool”
The “Exploratory Data Analysis Tool Online” is an intuitive web-based utility designed for data analysts, researchers, and students. This tool simplifies the process of inspecting, analyzing, and visualizing datasets to uncover patterns, trends, and insights.
What is Exploratory Data Analysis (EDA)?
Exploratory Data Analysis is a statistical approach used to analyze datasets, summarize their main characteristics, and visually represent them. It helps identify patterns, detect anomalies, test hypotheses, and check assumptions using statistical and graphical techniques.
Use Cases:
- Business Insights: Analyze sales, customer behavior, and financial data.
- Research Projects: Summarize survey or experimental data.
- Academic Learning: Understand statistical distributions and relationships in datasets.
- Data Preparation: Detect outliers, missing values, and correlations before applying machine learning models.
Key Features of the Tool
Flexible Data Input:
- Upload CSV files directly.
- Automatically parses and processes datasets of various sizes.
Comprehensive Statistical Summary:
- View mean, median, mode, standard deviation, and other descriptive statistics.
- Identify missing values and null counts in the dataset.
Interactive Visualizations:
- Generate histograms, scatter plots, bar charts, and correlation heatmaps.
- Customize visualization parameters for better insights.
Advanced Data Inspection:
- Explore dataset distributions and relationships interactively.
- Filter data and analyze specific subsets.
Export and Sharing:
- Export analyzed insights and visualizations as images or PDF reports.
- Save your exploration results for further use.
Secure and Client-Side:
- Ensures data privacy by performing all operations locally in the browser.
- No data is uploaded to external servers.
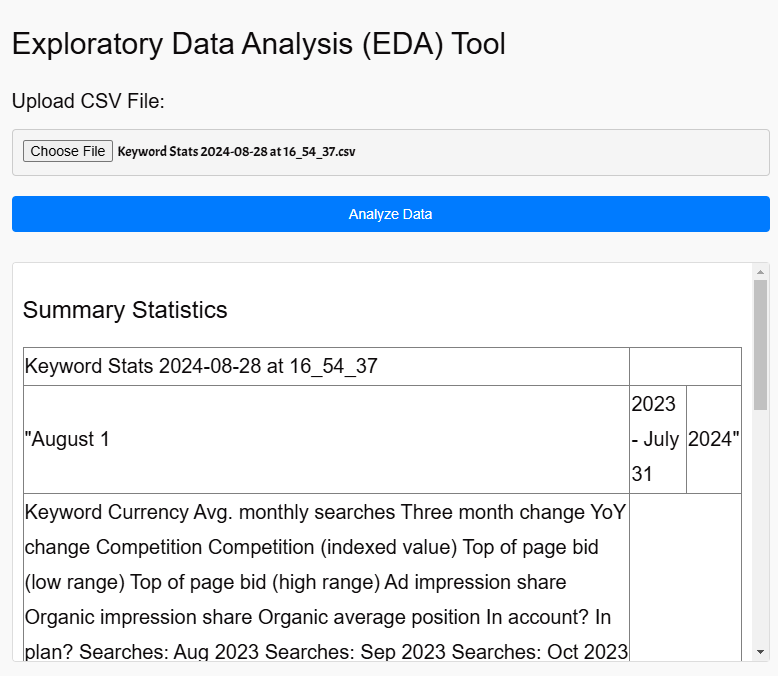
How to Use the Tool
Step 1: Upload Data
- Click on the “Upload CSV” button and select your dataset.
Step 2: Analyze Data
- View the automatically generated statistical summary.
- Check for missing values, duplicates, and data distributions.
Step 3: Visualize Data
- Use the interactive chart options to create scatter plots, histograms, or heatmaps.
- Customize your charts by selecting variables of interest.
Step 4: Export Results
- Download the visualizations or summary report as images or a PDF.
Example:
Input Dataset:
CSV File:
| Name | Age | Salary | City |
|---|---|---|---|
| Alice | 30 | 50000 | New York |
| Bob | 25 | 45000 | Los Angeles |
| Charlie | 35 | 70000 | Chicago |
Output:
Statistical Summary:
- Average Age: 30
- Average Salary: $55,000
Visualizations:
- Histogram of Salaries.
- Scatter plot of Age vs. Salary.
Benefits of the Tool
- User-Friendly: Simplifies EDA without requiring coding skills.
- Insightful: Provides actionable insights through data visualization.
- Efficient: Saves time in analyzing and preparing data.
- Secure: Keeps all data processing local to your browser.
This tool is perfect for data analysts, students, researchers, and professionals who want a quick, user-friendly way to perform exploratory data analysis. Let us know if you need additional features or enhancements!
(FAQ) for the Exploratory Data Analysis Tool Online
- What is the Exploratory Data Analysis Tool Online?
The Exploratory Data Analysis Tool Online is a web-based platform designed to help users analyze and visualize their data efficiently. It provides a user-friendly interface for importing, cleaning, and exploring datasets without requiring extensive programming knowledge. - Who can use this tool?
This tool is suitable for data analysts, data scientists, business professionals, and anyone interested in gaining insights from their data. Whether you are a beginner or an experienced analyst, the tool caters to various skill levels. - What types of data can I analyze?
You can analyze a wide range of data formats including CSV, Excel, JSON, and connect to databases like MySQL, PostgreSQL, and more. The tool supports various data sources to ensure flexibility in your analysis. - How does the data visualization feature work?
The tool offers a variety of visualization options, allowing you to create charts and graphs easily. You can explore your data visually to identify patterns, trends, and anomalies that may not be apparent in raw data. - Is there a way to clean my data within the tool?
Yes, the Exploratory Data Analysis Tool Online includes features for data cleaning. You can handle missing values, remove duplicates, and correct data types to ensure your dataset is ready for analysis. - Can I perform statistical analysis with this tool?
Absolutely! The tool provides access to various statistical methods and machine learning algorithms that enable you to perform in-depth analyses and gain deeper insights from your data. - Do I need any programming skills to use this tool?
No programming skills are required! The tool is designed with an intuitive interface that allows users to perform exploratory data analysis through simple clicks rather than complex coding. - Is my data secure when using this tool?
Yes, we prioritize your data security and privacy. All data processed through our platform is handled with strict security measures in place to protect your information. - Can I collaborate with others using this tool?
Yes, the platform supports collaboration features that allow you to share your findings and insights with team members easily. You can also create reports that summarize your analysis for stakeholders. - How can I get started with the Exploratory Data Analysis Tool Online?
Simply visit our website, sign up for an account, and start uploading your datasets. Our guided tutorials will help you navigate through the features and maximize your analysis experience.


Leave a Reply